Budget Planner Calculator for US Market
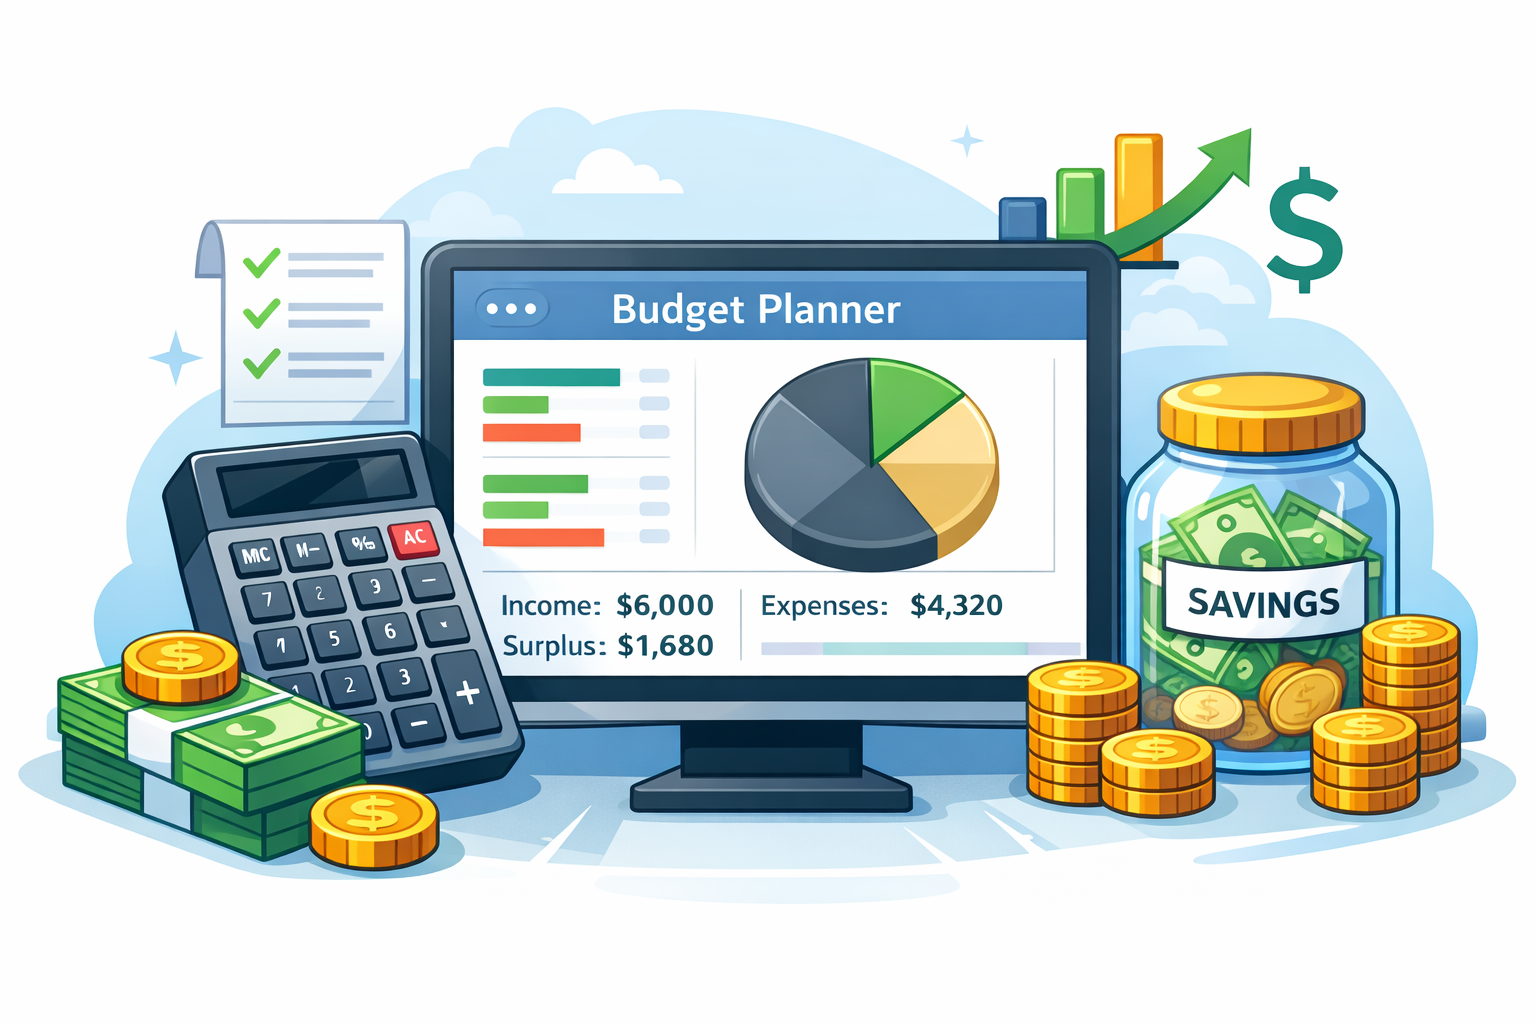
Plan monthly spending, track categories, and understand your estimated surplus or deficit. Organize fixed and variable expenses with a visual allocation summary — no sign-up required.
- Total income and total outflow
- Estimated monthly surplus or deficit
- Percent breakdown across categories
- Allocation chart for quick review
| Category | 50/30/20 guide |
|---|---|
| Needs (housing, utilities, food, insurance) | ≤ 50% |
| Wants (dining, entertainment, subscriptions) | ≤ 30% |
| Savings & debt repayment | ≥ 20% |
| Emergency fund target | 3–6 months |
| Retirement savings (general target) | 10–15% of income |
Free Budget Planner Calculator (US) – Save More Money
Use our Budget Planner Calculator to plan monthly spending, track categories, and understand your estimated surplus or deficit based on the numbers you enter. This tool is designed for scenario testing: try different income levels, expense categories, and savings targets to see how changes impact your monthly cash flow.
- Organize expenses into fixed and variable categories
- Set a savings target and track remaining cash flow
- See a clean allocation summary with a visual chart
Methodology & Assumptions
The Budget Planner Calculator totals monthly income and outflows across categories you enter. Percent breakdowns are calculated as a share of total income. The chart is a visual summary only. This tool does not classify spending as “good” or “bad,” and it does not provide financial advice.
The model treats each line item as a monthly average, which makes it useful for quick scenario testing. If you have irregular expenses (quarterly insurance premiums, annual subscriptions, seasonal utility spikes), you can represent them by converting to a monthly equivalent (annual cost ÷ 12).
The calculator separates fixed expenses (more predictable, such as housing or insurance) from variable expenses (more flexible, such as groceries, dining, or shopping). This distinction is intentional: when a budget shows a deficit, variable categories are typically easier to adjust than fixed commitments.
The chart is a visual summary of allocation, not a forecast. It does not account for inflation, income growth, taxes, or investment returns unless you incorporate those effects manually. For foundational budgeting concepts, review educational resources from the Consumer Financial Protection Bureau (CFPB). After reviewing monthly cash flow, summarize assets and liabilities using our Net Worth Calculator.
InvestingLab.com is not affiliated with the CFPB and does not provide financial, tax, or legal advice.
Frequently Asked Questions
Does this tool save my data?
Can I add custom categories?
Is this budgeting advice?
What is the 50/30/20 rule shown in the benchmarks?
How do I handle irregular expenses?
Related Tools
Use these tools alongside the Budget Planner Calculator to build a complete financial picture: